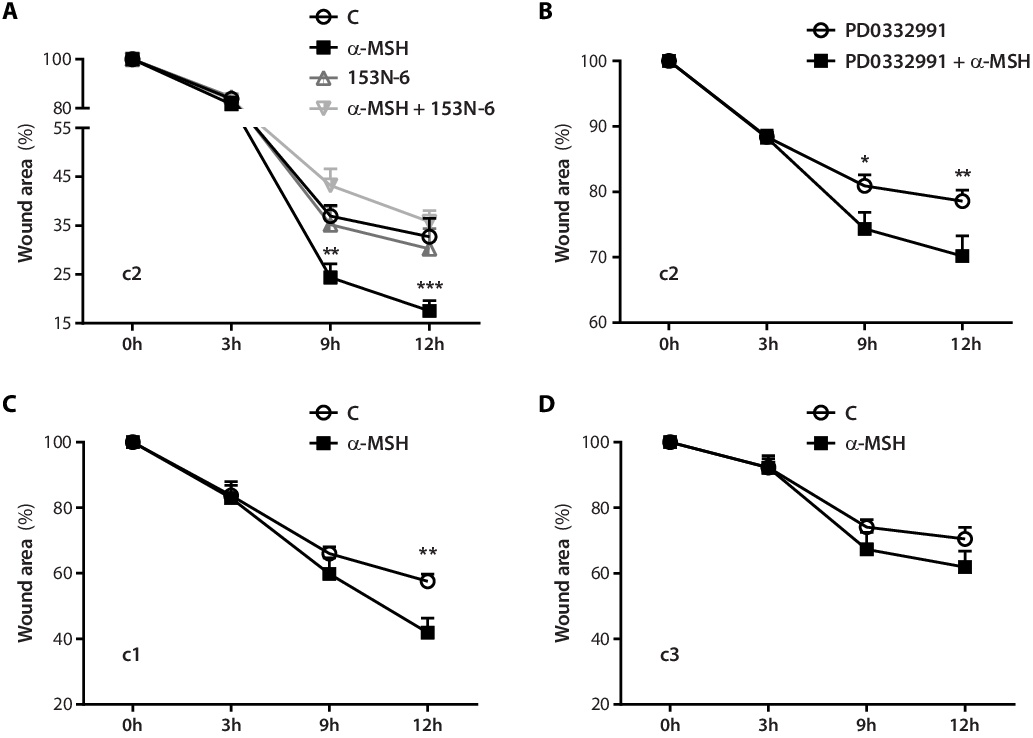
Fig. 2. MC1R activation enhances HAoEC migration. (A) After insert removal, HAoEC (no. c2) monolayers were treated with α-MSH 10-8 M, with or without the MC1R-antagonist 153N-6 10-5 M, and allowed to migrate for 3, 9, and 12h: gap closure was quantified using DiR cell staining and near-infrared fluorescence scanning. Results are shown as mean ± SEM (n = 6). Statistical significance of differences was assessed by two-way ANOVA [F(9,80) = 2.957, p=0.0044, interaction time × treatment; F(3,80) = 10.85, p<0.0001, treatment effect] with Bonferroni post-hoc test [**p<0.01, ***p<0.001, α-MSH vs. medium alone (C)]. (B) Directional migration assay was repeated in the presence of the proliferation inhibitor PD0332991. Results are shown as mean ± SEM (n = 10). Statistical significance of differences was assessed by two-way ANOVA [F(3,72) = 3.018, p=0.0353, for interaction; F(1,72) = 9.074, p=0.0036, treatment effect] with Bonferroni post-hoc test (*p<0.05, **p<0.01). (C) The migration assay was repeated with HAoECs no. c1, the other cell line bearing wild-type MC1R alleles. Results are shown as mean ± SEM (n = 4). Statistical significance was assessed by two-way ANOVA [F(1,24) = 6.016, p=0.0218, for treatment effect] with Bonferroni post-hoc test (**p<0.01). (D) The migration assay was finally repeated with HAoECs no. c3, carrying a loss-of-function mutation in the MC1R gene. Results are shown as mean ± SEM (n = 5). Two-way ANOVA with Bonferroni post-hoc test showed no statistically significant differences.